Stepping through the failing data

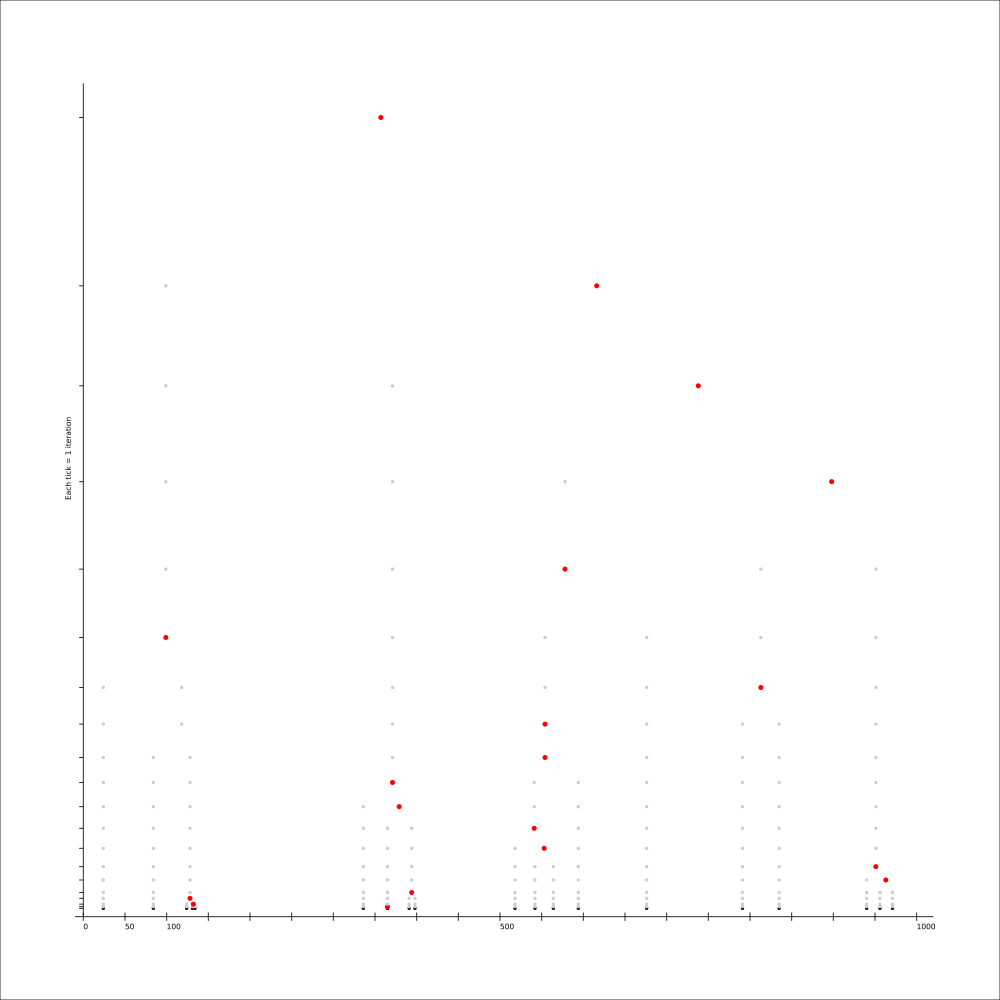
This is a thumbnail of a visualisation of the separate clustering steps. Open original SVG file for better readability.
The linked image shows the individual steps through the existing clustering algorithm. Each "horizontal line" (the Y-Axis) represents one step of the algorithm. The distance between each "line" represents the level of the created cluster. The first line represents the input data (the black dots).
The X-Axis represents the input values (which ranged roughly between 0 and 1000).
On each iteration, the last generated cluster is marked as a red circle, where previous datums are shown as gray circles. As mentioned, the black dots on the first line are the input values.
Stepping through the code like this has revealed, that the error is not where I think it is. The values here are all straight out of debugging data from a test-run. In this execution, all values were present. Nothing went missing. I will have to continue my search...
